


See More ![]()
Mauritius’ Rainfall Patterns: Everything You Need to Know about Rainfall Distribution, Trends and Seasons
Planning a trip to Mauritius or curious about its climate?
Mauritius boasts its own microclimate where rainfall patterns can vary dramatically within short distances. This diversity adds an element of unpredictability to the island's weather, making it essential to treat its weather statistics with caution.
By understanding Mauritius’s rainfall patterns, visitors can better plan their activities and explore the island’s diverse climate.
What are the rainfall seasons in Mauritius?
Mauritius experiences two main seasons in terms of rainfall:
- Hot, wet season: From November to April
- Cool, dry season: From May to October
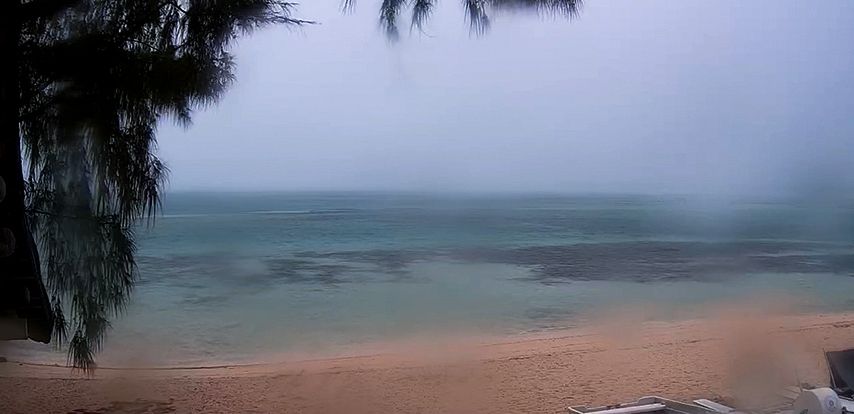
What to expect during the rainy season in Mauritius?
During the wet season, which coincides with the summer months, the island receives heavy rainfall, often associated with tropical cyclones passing through the region. Rainfall can be torrential but typically lasts for only a few days.
How does rainfall vary across the island?
Rainfall varies significantly from region to region. Annual rainfall is approximately 1100mm3 on the North coast but increases to around 5000 mm3 on the Central Plateau.
Relief and geographical factors play a crucial role in rainfall distribution across the island.
When is the best time to visit Mauritius considering rainfall?
For those seeking drier weather, the period from May to October during the cool, dry season is ideal. However, rainfall patterns can be unpredictable and occasional rain can occur even during the dry season.
Find out more about when to visit Mauritius according to the weather here.
How is rainfall measured in Mauritius?
Rainfall is measured at approximately 250 stations across Mauritius, along with stations in its outer islands (Rodrigues, Agalega and St. Brandon).
These stations are maintained by various government departments, sugar estates, and other authorities.
Long-term trends in Mauritius’ rainfall patterns:
- Based on long-term data analysis, it is indicated that the annual rainfall decreases at an average rate of around 57 mm per decade.
- However, variations in rainfall records can occur from year to year. The long-term mean annual rainfall over the island is 2100mm.
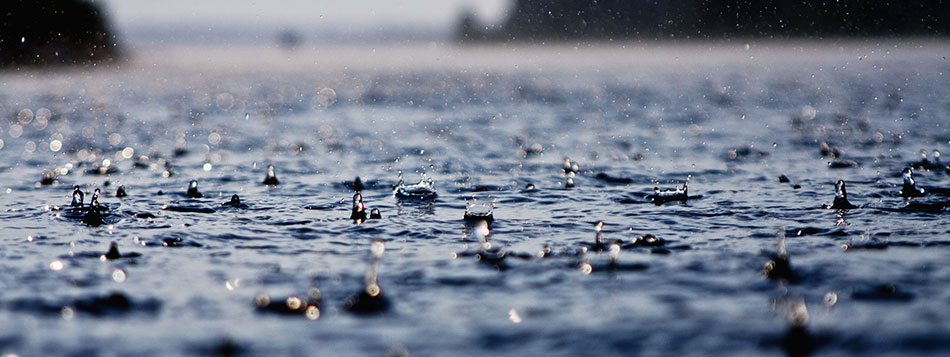
Torrential Rain in Mauritius
During the summer months, the risk of torrential rain is higher in Mauritius.
Torrential rain conditions exist when the accumulated rainfall reaches or is expected to reach 100 millimetres in a given region within the ensuing hour. Consequently, it may lead to flash floods or urban floods, with water accumulations and overflow of streams and rivers.
In such cases, the Mauritius Meteorological Services may issue flood warnings at regular intervals. You can stay updated by tuning in to local radio, TV stations or social media.